An optional module for the Perfect Image software package, CastImager is part of a software suite created specifically for metallurgical microscopy laboratories.
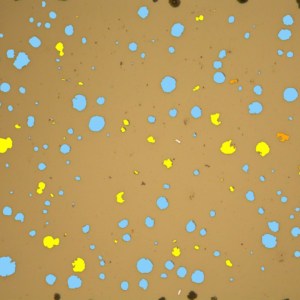
The module measures graphite nodularity and the different components in your sample, helping to improve your research and analyses. With its simple, user-friendly interface, Cast Imager is a reference in its field.
But let’s take a closer look at its different features.
About Cast iron analysis in metallography : Cast Imager
CastImager – what does the software provide ?
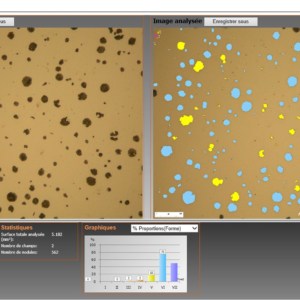
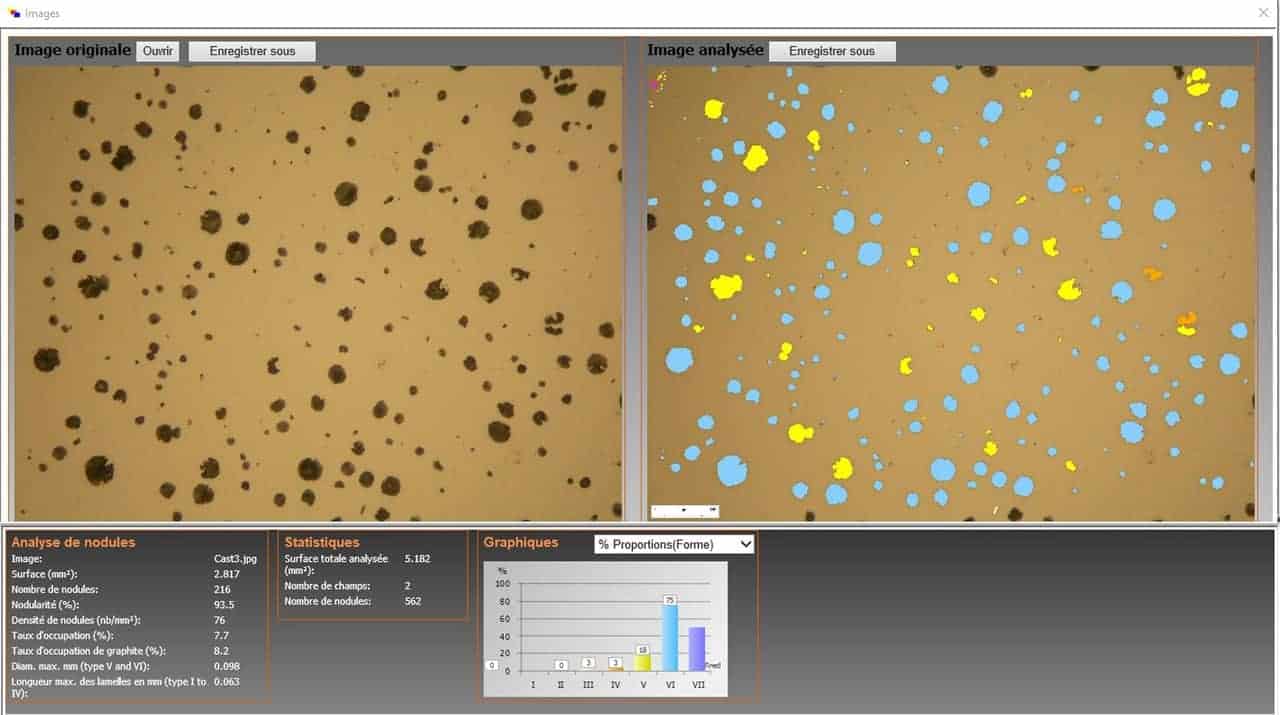
A standalone graphite nodule measurement software package, CastImager is a very comprehensive tool. The software meets NF ISO 945 and ASTM A247/ASTM E2567 standards, and enables you to measure many parameters using your captured images. Designed in partnership with cast production units, this module is currently the most comprehensive on the market.
Here are some of the analyses that CastImager carries out:
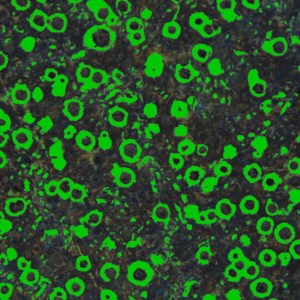
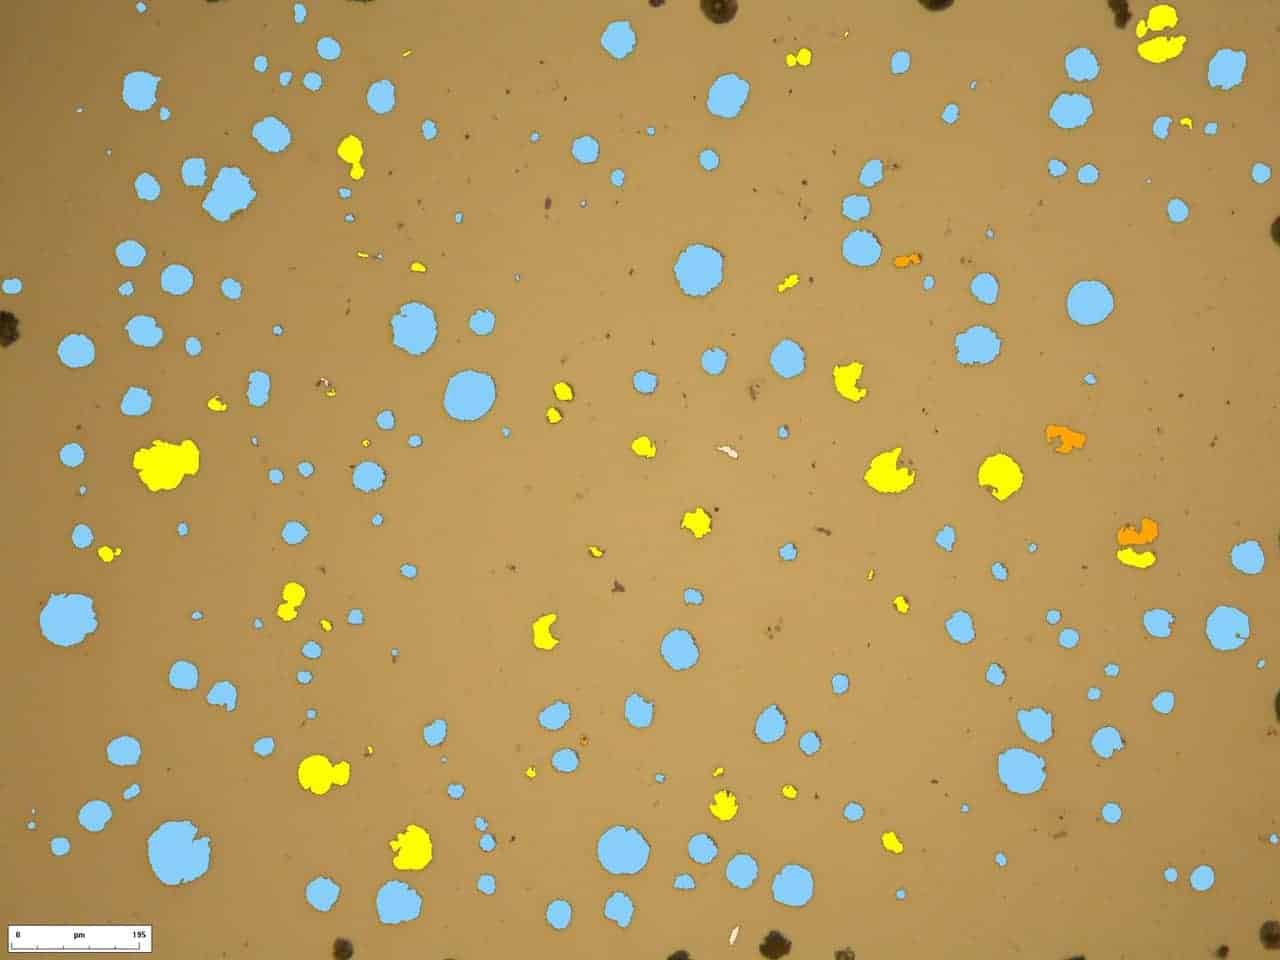
- Graphite nodularity analysis
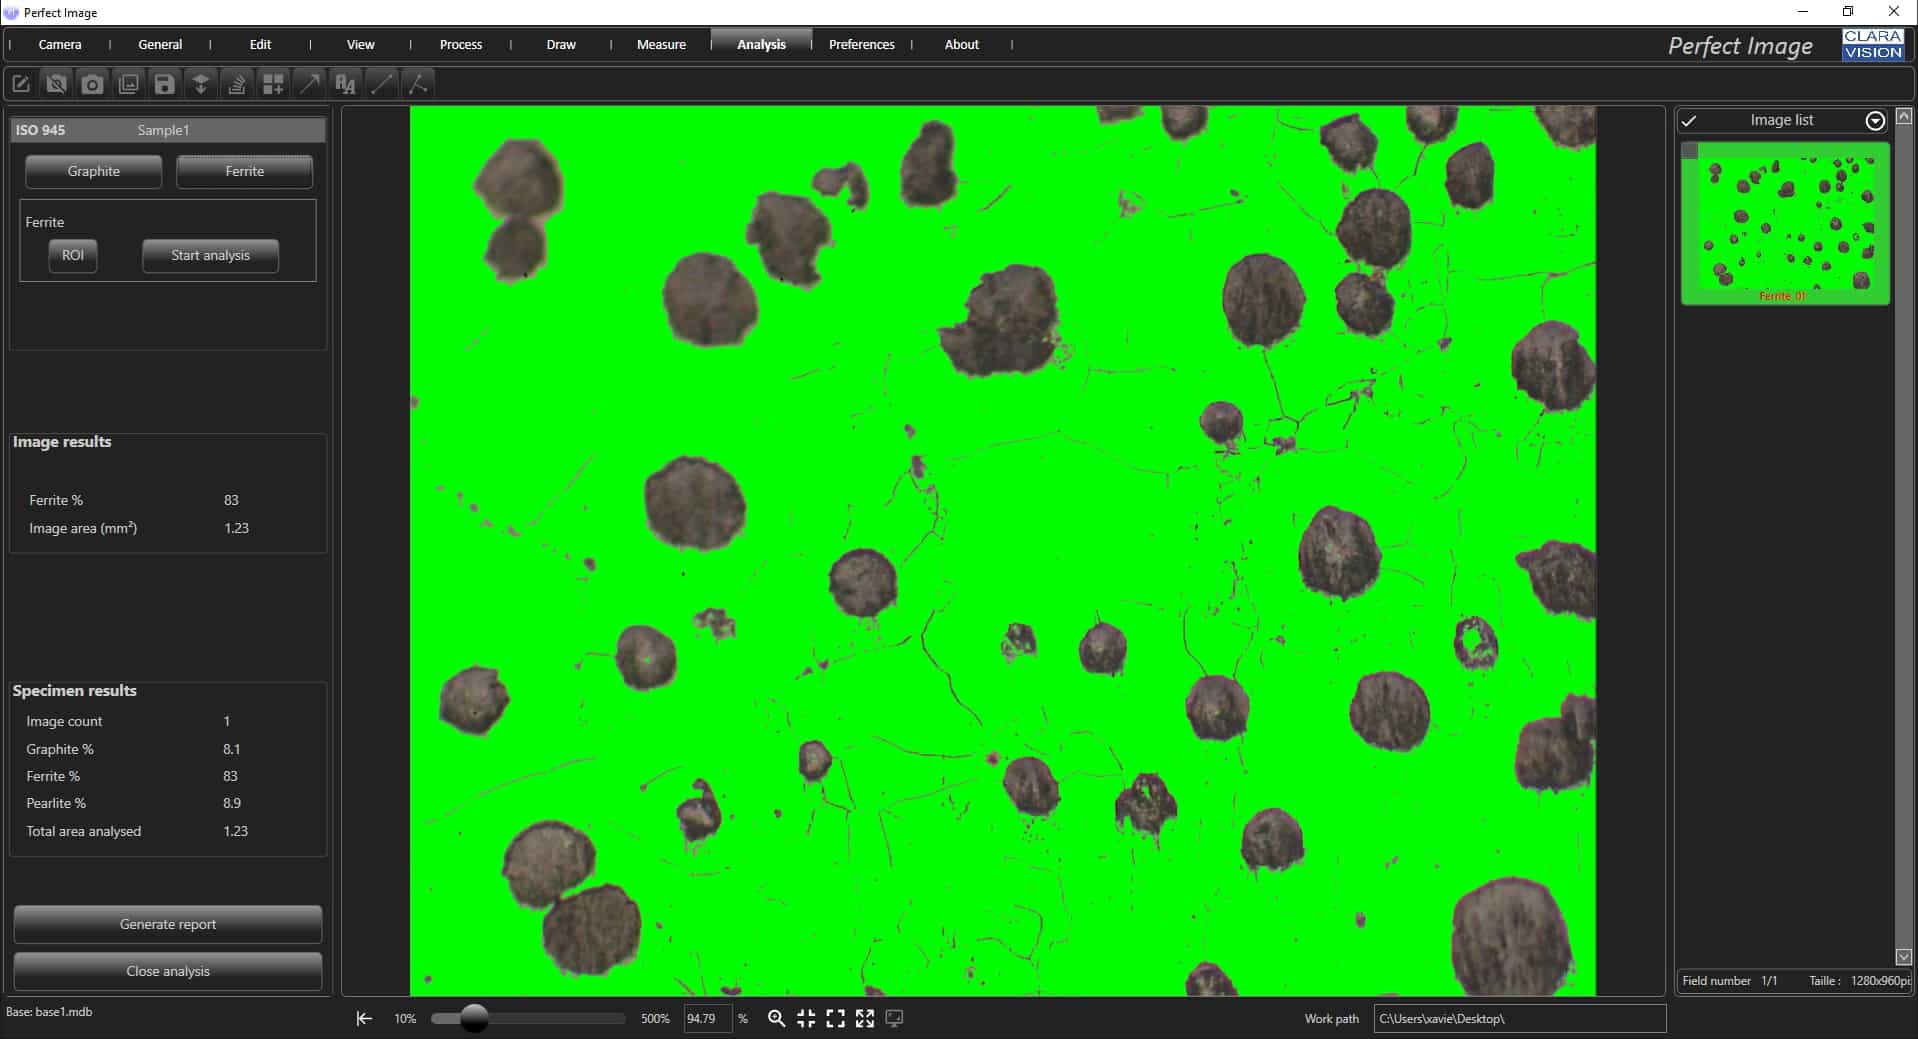
- Graphite percentage
- Ferrite percentage
- Pearlite percentage
Analysis history is automatically stored and can be reviewed at any time. In addition, data can be amended and new measurements can be taken.
Various measurements are possible, including :
- Nodule classification by shape
- Dimensions
- Density (number/mm2)
- Monitoring of the number of fields, number of nodules and surface area analysed.
- Ferrite/Graphite and Pearlite ratios
The importance of nodule analysis
The shape and size of graphite particles are fundamental aspects of the casts; they are directly related to the physical and mechanical properties of the substance.
It is an important phase if you wish to obtain a perfect cast. Poor nodularity, too many nodules, too few… all of these can affect the physical and mechanical properties of your part.
Calculating the ferrite and pearlite ratios
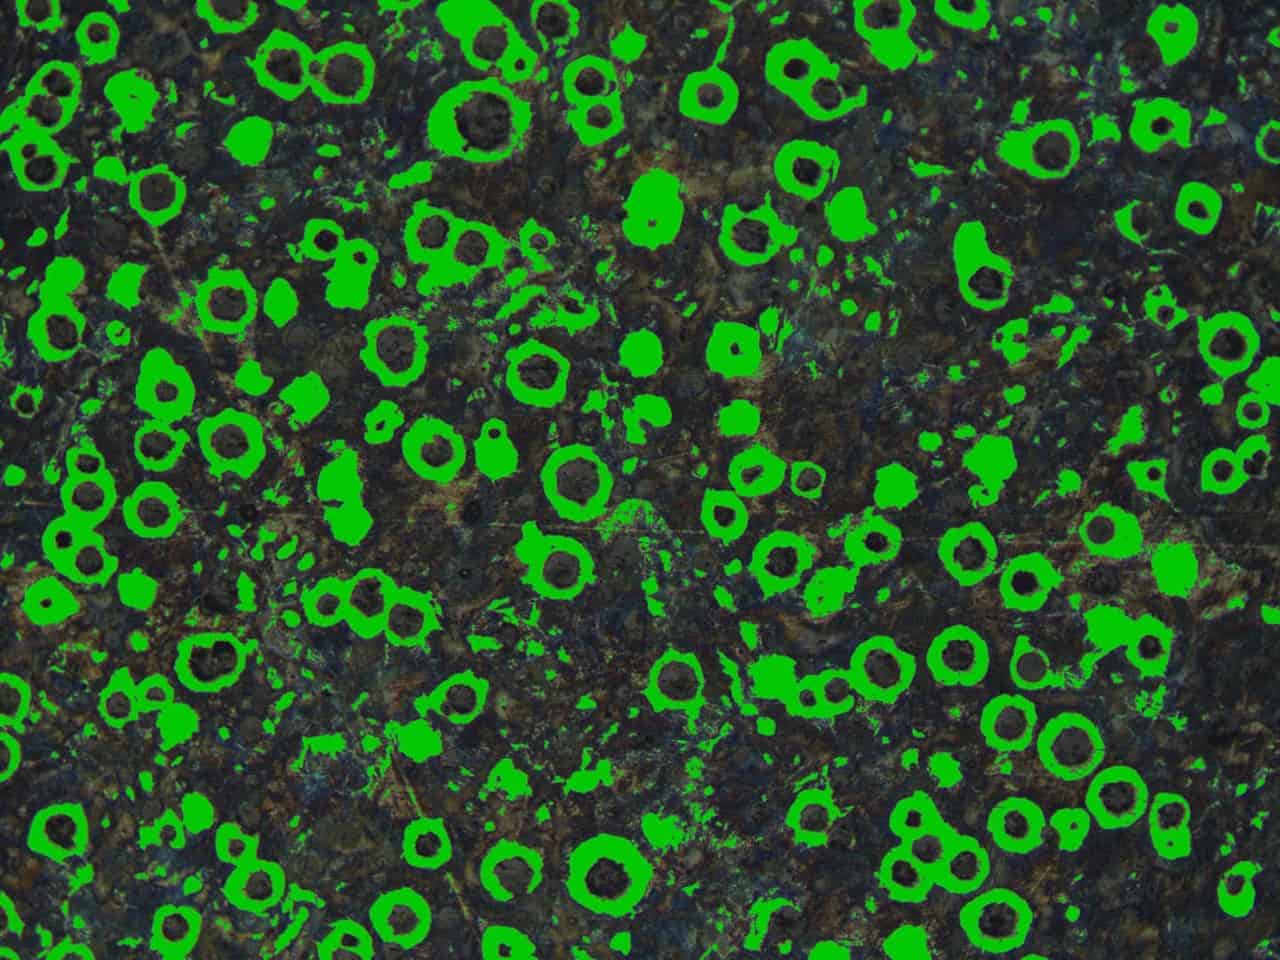
Cast Imager enables you to calculate ferrite and pearlite ratios, taking graphite presence in the capture into account.
Pearlite is present in steel and cast iron structures. It forms in the grain boundaries, and is more or less dense depending on the chosen cooling method. As for ferrite, it is a solution, essentially made up of carbon. It forms if alloys are added to the iron. By analysing this data, you will learn the overall composition of your sample, with percentages of , ferrite and graphite.
It’s a huge asset if you’re aiming for perfection!
Automated measurement reports
All of the results are stored automatically for each study. Previous studies can be viewed, amended or supplemented at any time. Study reports are created automatically at the click of a button, and include the statistical data on the analysis of your metallography sample, as well as the results for each image in your study.
